PassPredictR: Contextualizing NFL Throwing Decisions By Modeling Receiver Choice
Introduction
In football, the most important decision made by a quarterback during a throwing play is the throw target. In the same play, deciding to throw to one receiver may lead to a game-altering touchdown, and a throw to another receiver may result in a game-ending turnover. We can see this decision-making process in a game-tying touchdown throw from P.J. Walker to D.J. Moore against the Atlanta Falcons.
While a fantastic throw and catch, with 20 seconds left, P.J. Walker has several options, like to throw to a closer receiver and quickly get out of bounds to gain some valuable yardage for a more manageable touchdown attempt. Given the available safer choices, what would we expect other quarterbacks to do in this situation? Would they play it safe and throw to the safer man, or make the same decision to throw it down the field into double coverage for a chance to tie the game, despite the risk?
This paper aims to explore questions like these by modeling who the expected receiver would be given a game situation. By contextualizing throwing decisions, we can determine which quarterbacks deviate from our expectations the most, whether this deviation leads to stronger or weaker performances, and provide better nuance to assess passing plays and players. For example, for particularly harmful interceptions, we can contextualize the decision by determining whether other quarterbacks would make that same decision.
Data
In modeling this decision-making process, this work uses tracking and event data from the 2024 Big Data Bowl,1 which covers players from the first 9 weeks of the 2022 NFL Season.
Within this dataset, there are four different subtypes of data:
Game Data: Data which includes information such as the teams playing, date and time of the game, and final scorelines.
Play Data: Data describing the context and result of each play within each game, including the quarter, down, yards to go, pre and post-snap win probabilities, and formations.
Player Play Data: Data describing statistics for each player involved in a play, such as what route was ran by the player or an indicator describing if the player was targeted for a throw.
Tracking Data: Data describing the locations of players and the football at every frame of a play, including XY coordinates, player orientation, movement speed, and direction.
In this analysis, we exclusively look at throwing plays with an obvious target, removing spikes and throwaways.
Methodology
In following approaches to similar problems in soccer,2 we treat the problem of expected receiver as a learning-to-rank problem (LTR), building a model to generate a relative ranking for all receivers over the course of a play. This ranking approach allows us to take into account the other receivers when predicting most-likely receiver. A receiver may be wide open, but if another receiver is a much stronger option, the ranking approach will be able to take this difference into context.
On the other hand, a classification approach treats every recipient as an independent entry, disregarding other receivers. While this effect can be mitigated by applying a softmax normalization to the receivers of a play, we chose to pursue a ranking model to better account for other receivers when predicting who the ball is going to.
While this problem has been broached with a deep learning method3, we intend to use XGBoost with dozens of hand-crafted features to derive these rankings, aiming to build a model with similar prediction power with newer tracking data and a less computationally expensive approach. This also allows us to have more interpretable results, opening our work up to broader audiences and discussions.
The Obvious First Answer: Spacing
An obvious initial answer to finding expected receiver is simply taking the receiver that is the most open at the time of throw. While this has some predictive power, with 31.6% of throws going to the player who is furthest from their closest defender, compared to the 20% baseline (guessing out of 5 at random), this spacing at the time of the throw still tells a relatively incomplete story.
As exemplified by this throw, Davante Adams is well covered at the time of pass release, but because of speed and direction differences with his closest defender, he is able to find separation by the time the catch is made. It is often the potential to find space at time of catch that is more important than space at time of throw.
Therefore, to derive a proxy for space at reception, we account for the speed and direction of a player at time of throw, deriving a distance between a receiver and a defender with the speed vectors.
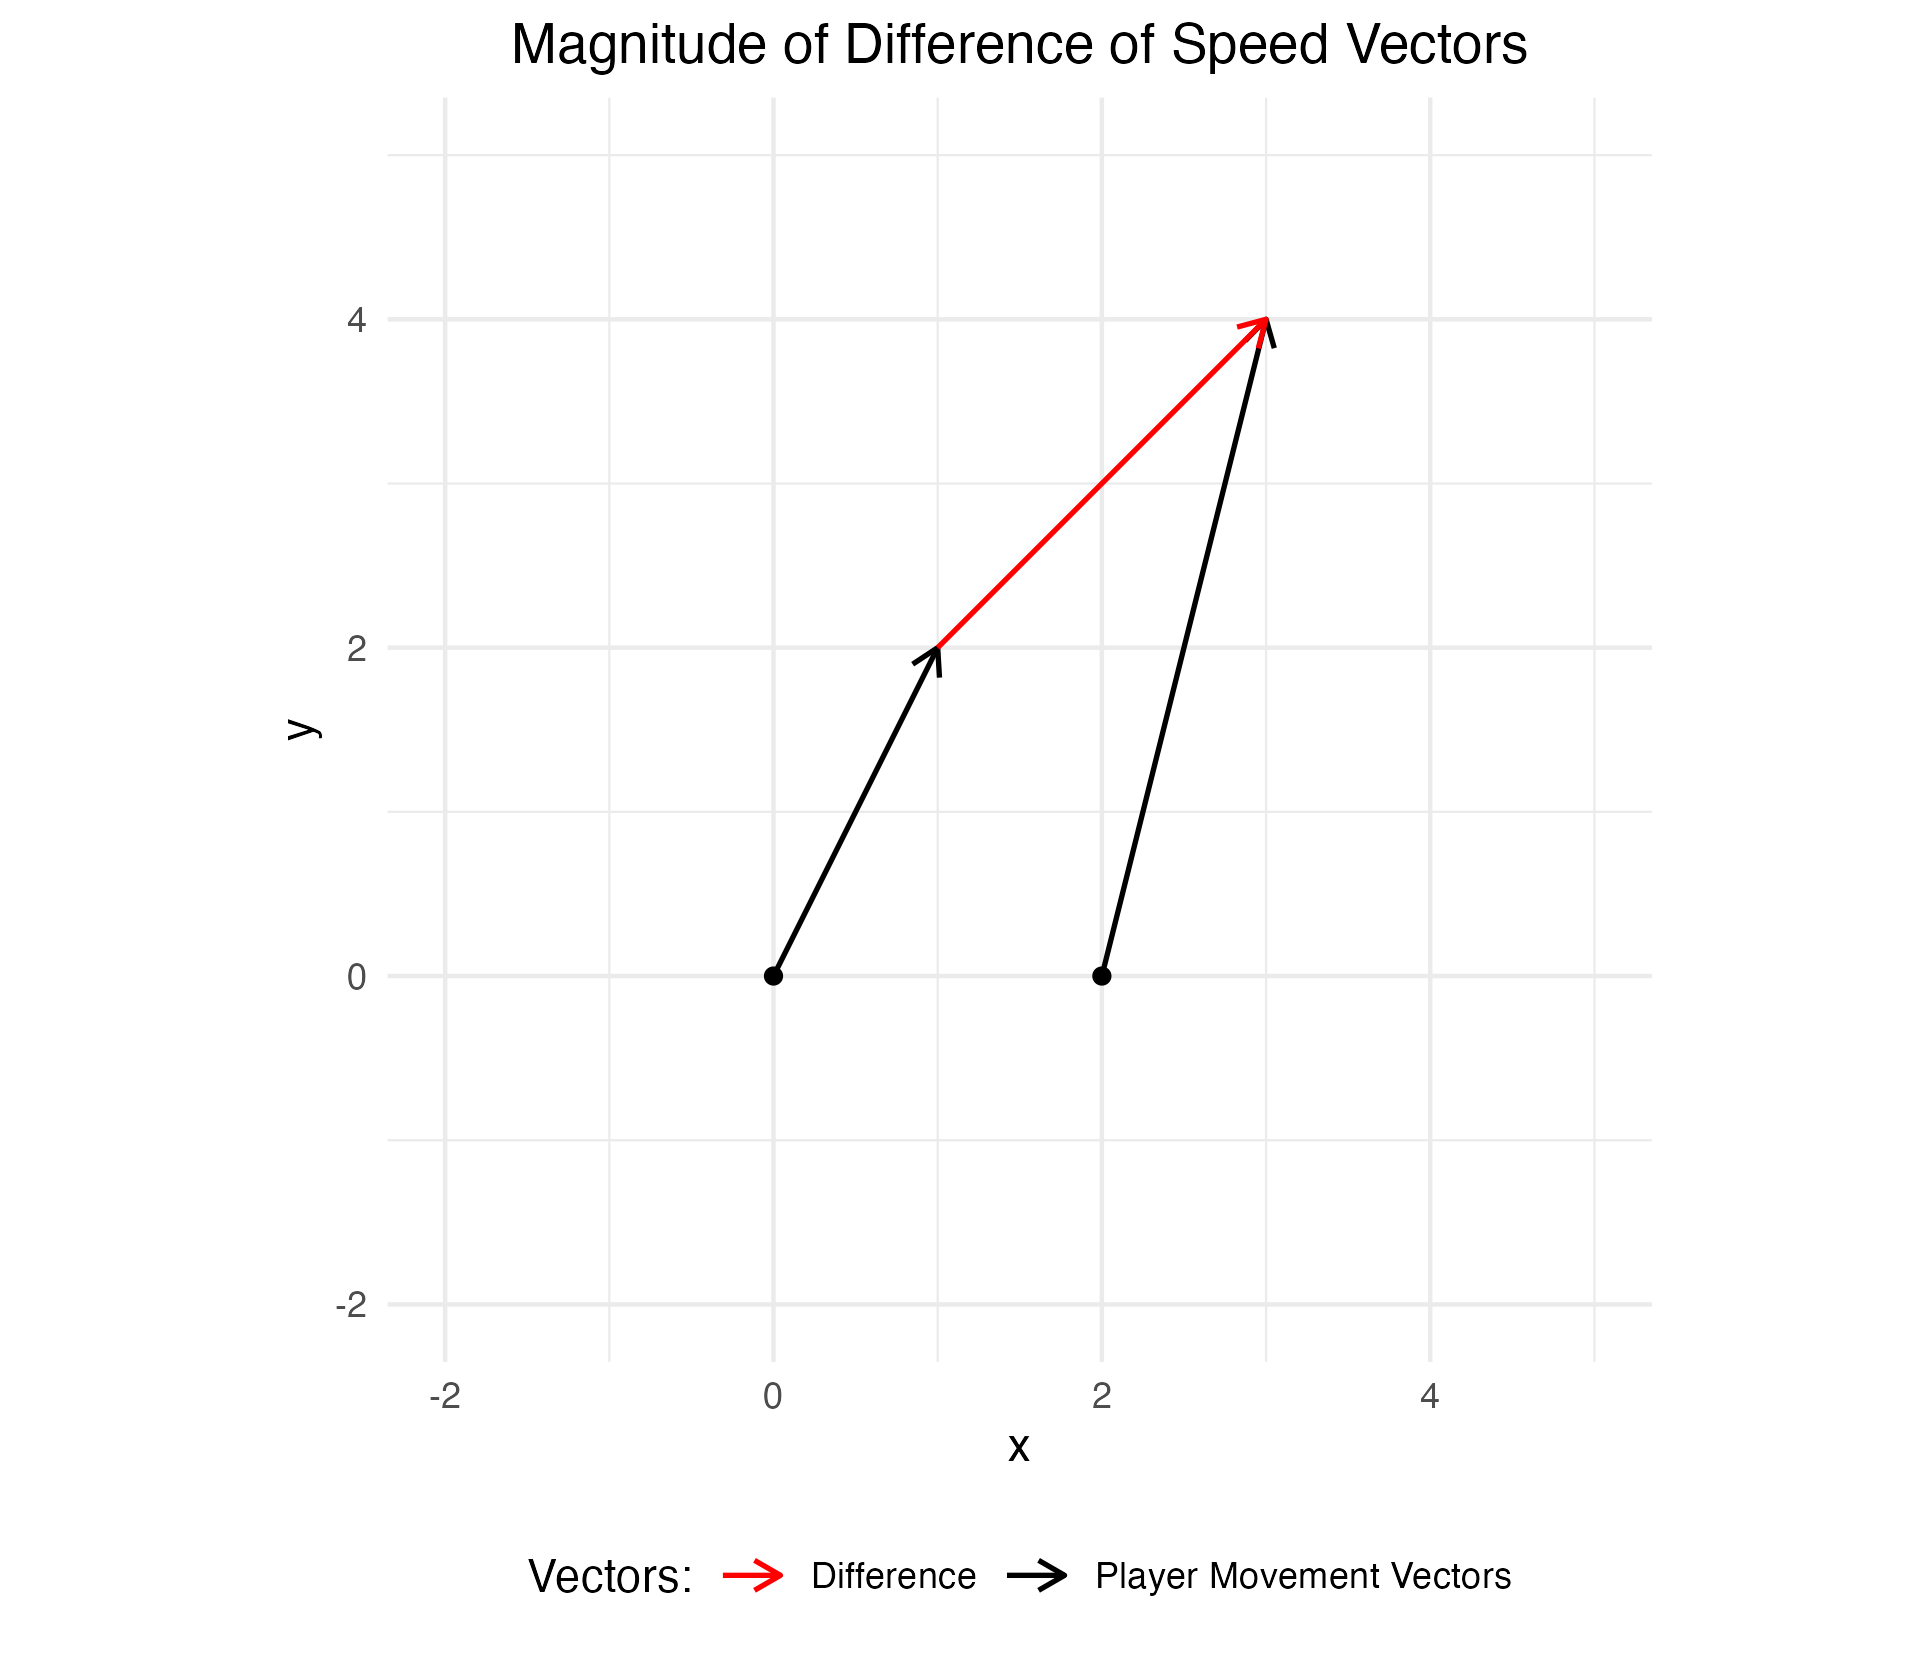
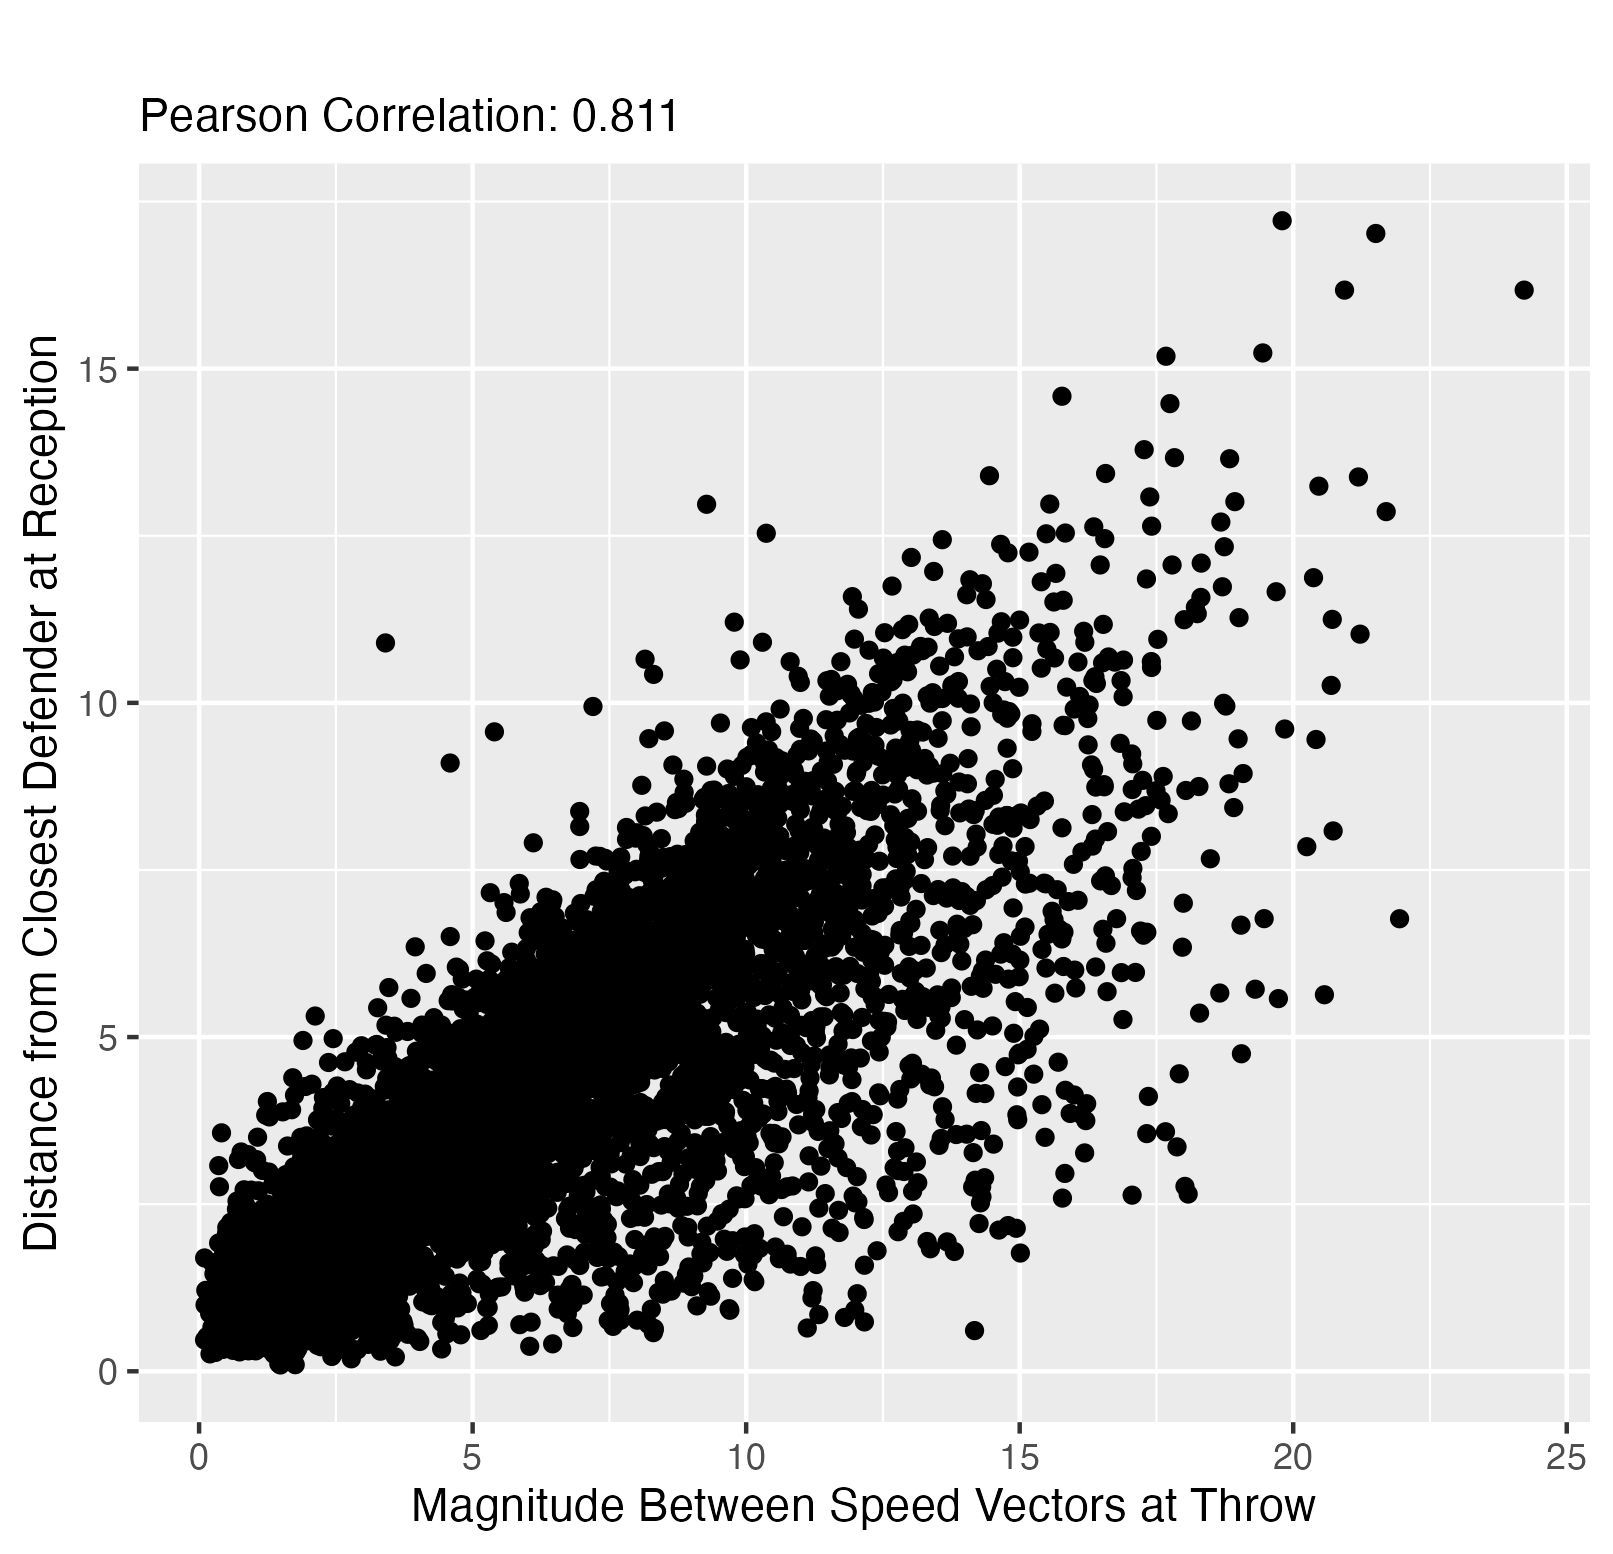
By adding speed and orientation, this distance correlates stronger with separation at catch, generating a correlation of 0.811 as compared to the correlation with current separation and catch separation, with a correlation of 0.73.
A Proxy for QB Information: QB Vision
It’s no secret that where the quarterback is looking plays a huge part in his decision making process, and therefore in predicting where he’ll be throwing. It was crucial to our model’s completeness, therefore, to develop some way to diagnose where the QB is looking in relation to the various passing options.
In this play for the Broncos in 2022, we’re able to see the change in angle of the quarterback’s orientation and line of sight (LoS), making his first read to Melvin Gordon (Gold), and then to Courtland Sutton (Red), with plenty of potential for space, as outlined above. When Russell Wilson sees this, he makes the throw almost immediately for a first down. The importance of a receiver’s distance in yards from the quarterback’s LoS is on full display here, as we see a sudden dip in that distance to Sutton as Wilson sees him and makes the throw.
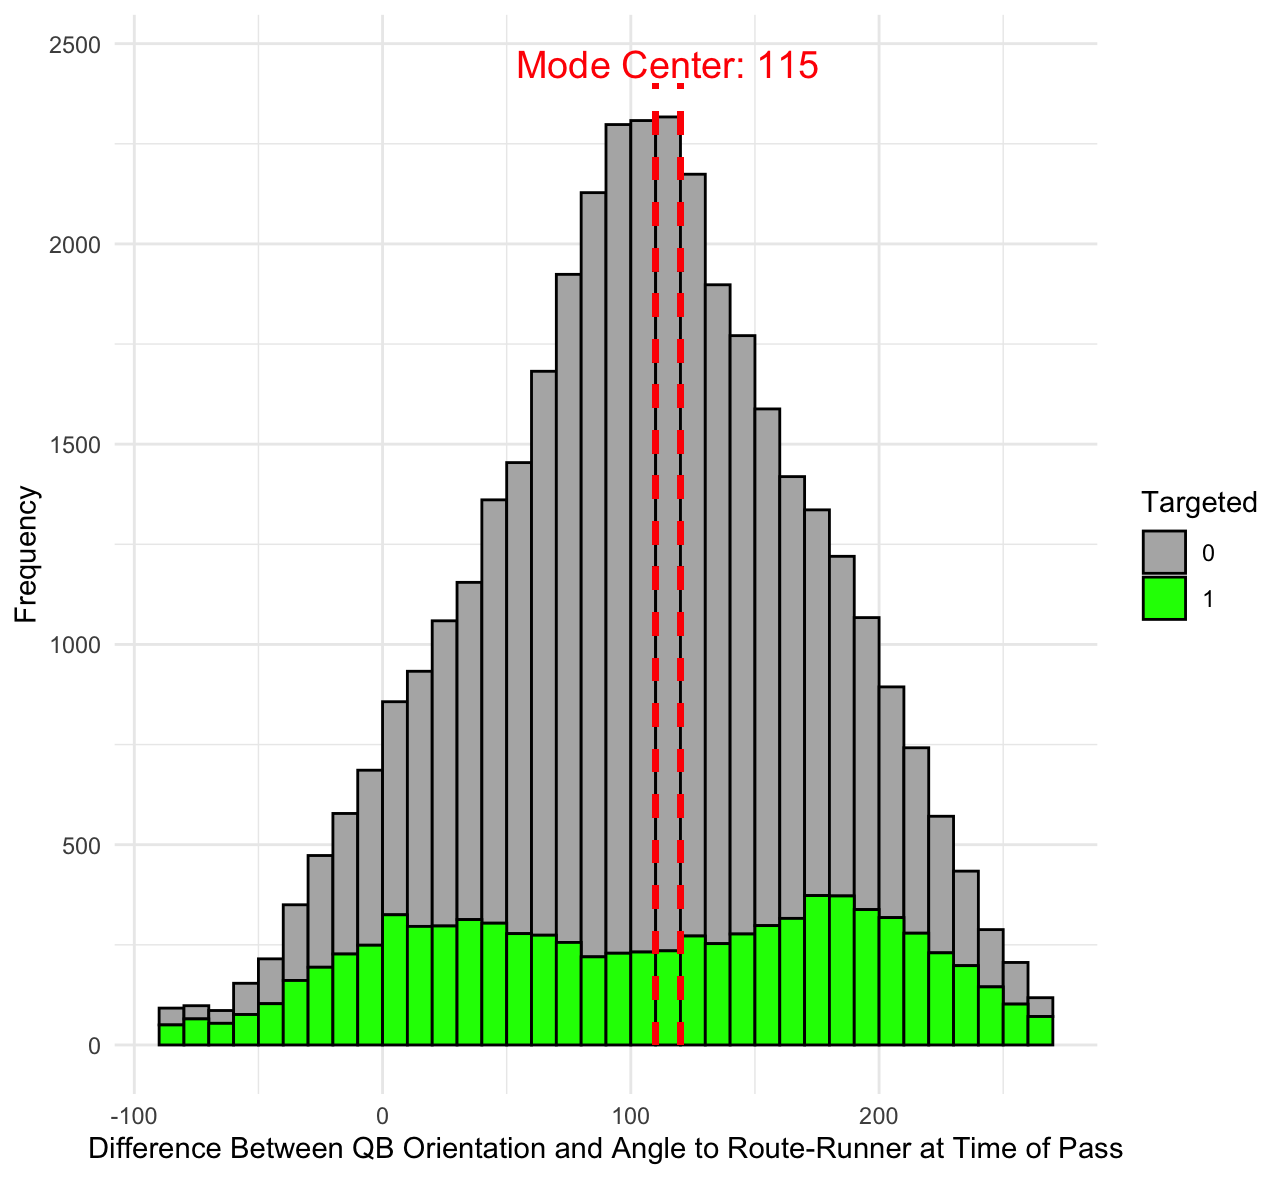
Another valuable feature in determining where a quarterback will throw is the angular difference between the pass angle and line of sight. When we account for distance or angle differential alone, the targeted receiver is the closest receiver in at least one of the two factors in 44.6% of all frames throughout the average play. Although this metric is far from robust, it still provides a very helpful proxy for understanding the steps and options a quarterback goes through throughout a play, and is helpful to build our model.
Final Feature Set
In combination with these metrics, we derive a feature set which captures the game-state in three categories: the receiver, the quarterback, and the game context.
| Feature Category | Features |
|---|---|
| Recipient Features | - Distance (x, y, magnitude)* - Speed Differences (x, y, magnitude)* - Orientation Differences* - Speed Vector Distances* - Receiver Position - First Down Indicator - Number of Defenders in Route-Runner’s “Next 5 Yards” |
| Quarterback Features | - Distance from Receiver - Movement Vector - Angle between QB Orientation and Receiver 5 Frames Prior - Under Pressure Indicator |
| Game Context | - Quarter - Down and Distance - Score Differential - Time Remaining |
*Feature taken relative to the top-3 closest defenders
Using these features, we build an XGBoost ranking model where we use a random search hyperparameter tuning approach, validated using 5-fold cross validation, with folds along games, which yields a top-1 accuracy of 59.9 \(\pm\) 0.5%, significantly stronger than both a naive estimate (20%) as well as the separation-based approach (31.6%). Additionally, given the inherent variability in quarterback decision-making, as well as defenses looking to prioritize preventing obvious yards, this accuracy reflects strong model performance.
Results
In applying this model, we illustrate potential use cases for our model in analyzing quarterbacks. However, for future usage, work should be done in predicting the utility of potential receivers, allowing decision analysis to be done with concern for more than the ‘expected’ throwing decision. We believe that this model can and should be developed and used beyond the simple point estimates we generate here.
Expected Target for the DJ Moore Throw
We can now apply our model back to the DJ Moore throw to determine the expected target, given the game state:
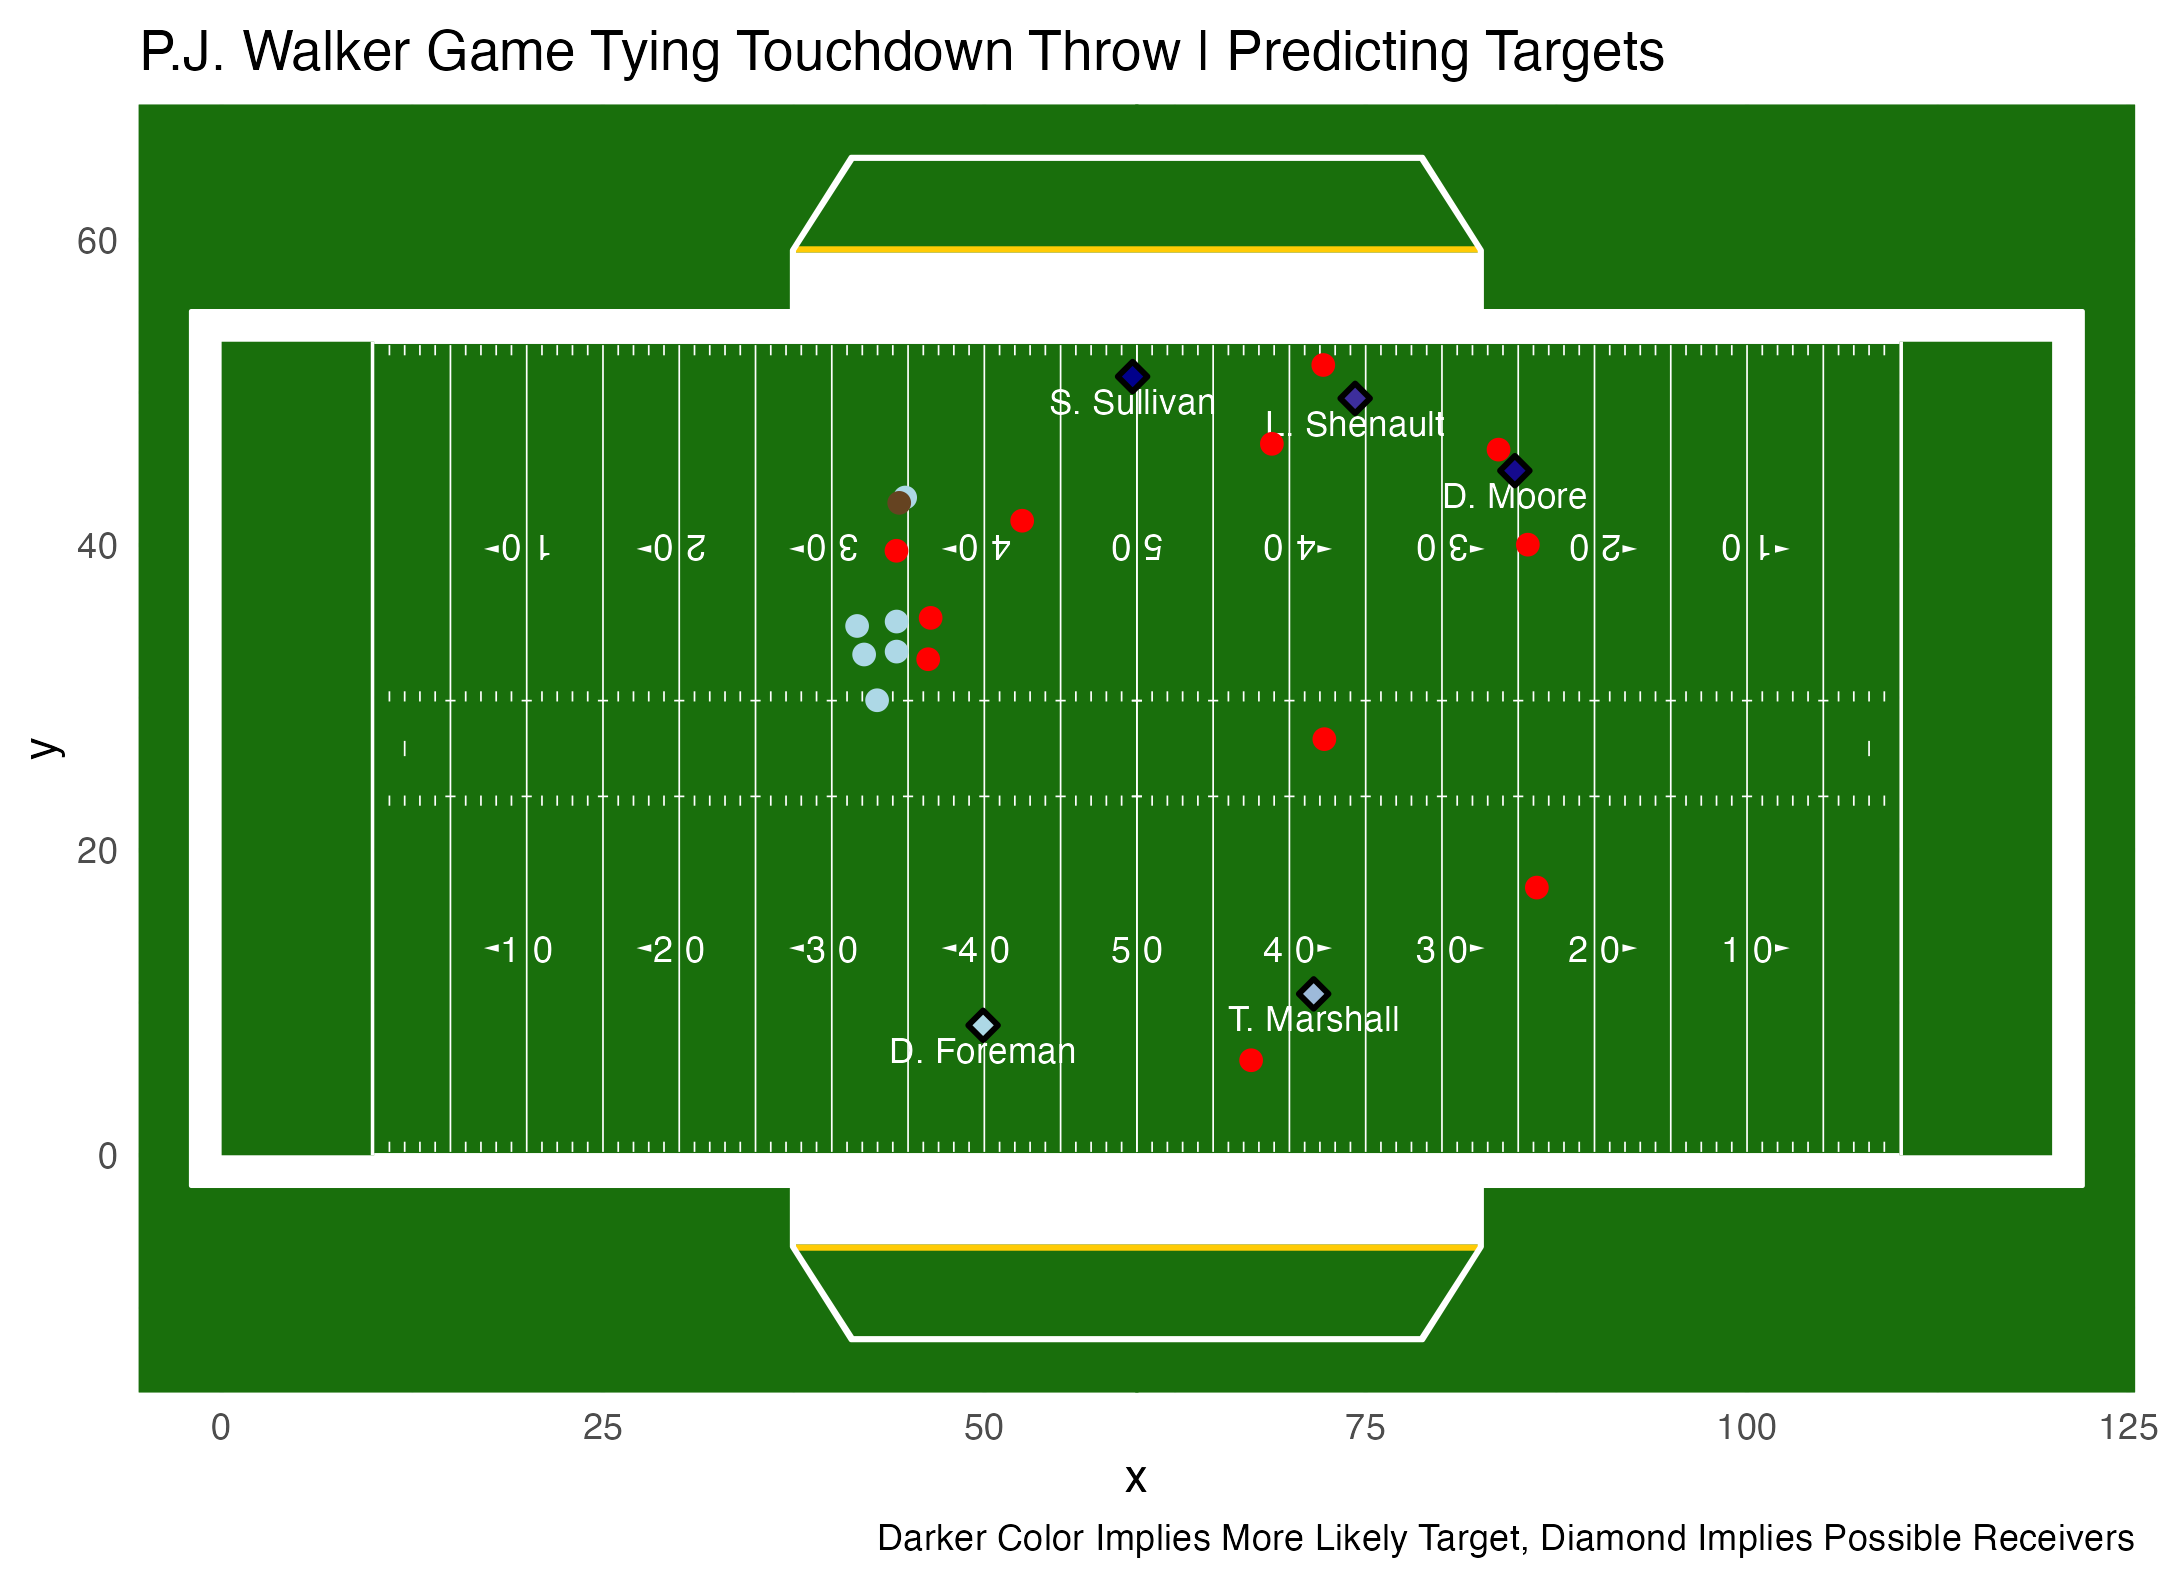
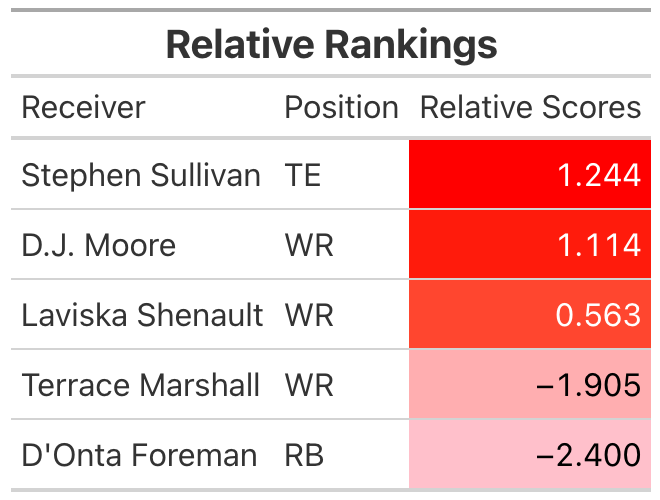
We see that the expected receiver is Stephen Sullivan, where a reception could keep the drive going and gain good yardage, while the targeted receiver, D.J. Moore, is ranked the 2nd most likely receiver. Therefore, we have grounds to infer that the throw by P.J. Walker is perhaps not what some other quarterbacks would donen in that situation, many likely playing it safer and making the throw to Sullivan.
Finding the Most Predictable and Unpredictable Quarterbacks
Using our model, we can also derive estimates for how predictable or unpredictable a quarterback is by finding the proportion of throws for which they agree with the model choice.
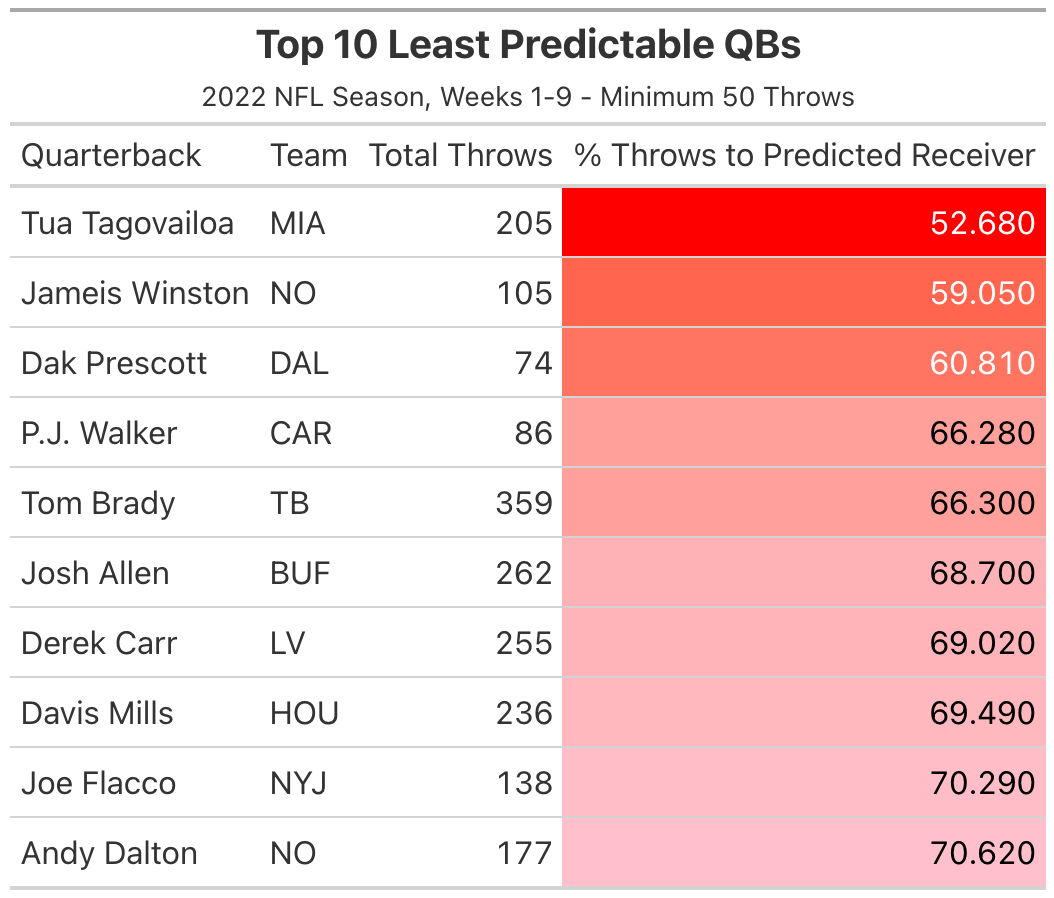
In applying the eye-test, we see that Jameis Winston, a quarterback well-known for playing in an often erratic and unpredictable manner, is the quarterback with the second lowest proportion of throws agreeing with the model. We also see Miami quarterback Tua Tagovailoa agreeing with the model the least; this disagreement could be due to the fact that Tagovailoa is the only left handed quarterback in the league, causing his decisions to be harder to model, or his strong wide receiver core, which allows him leeway to make suboptimal passes.
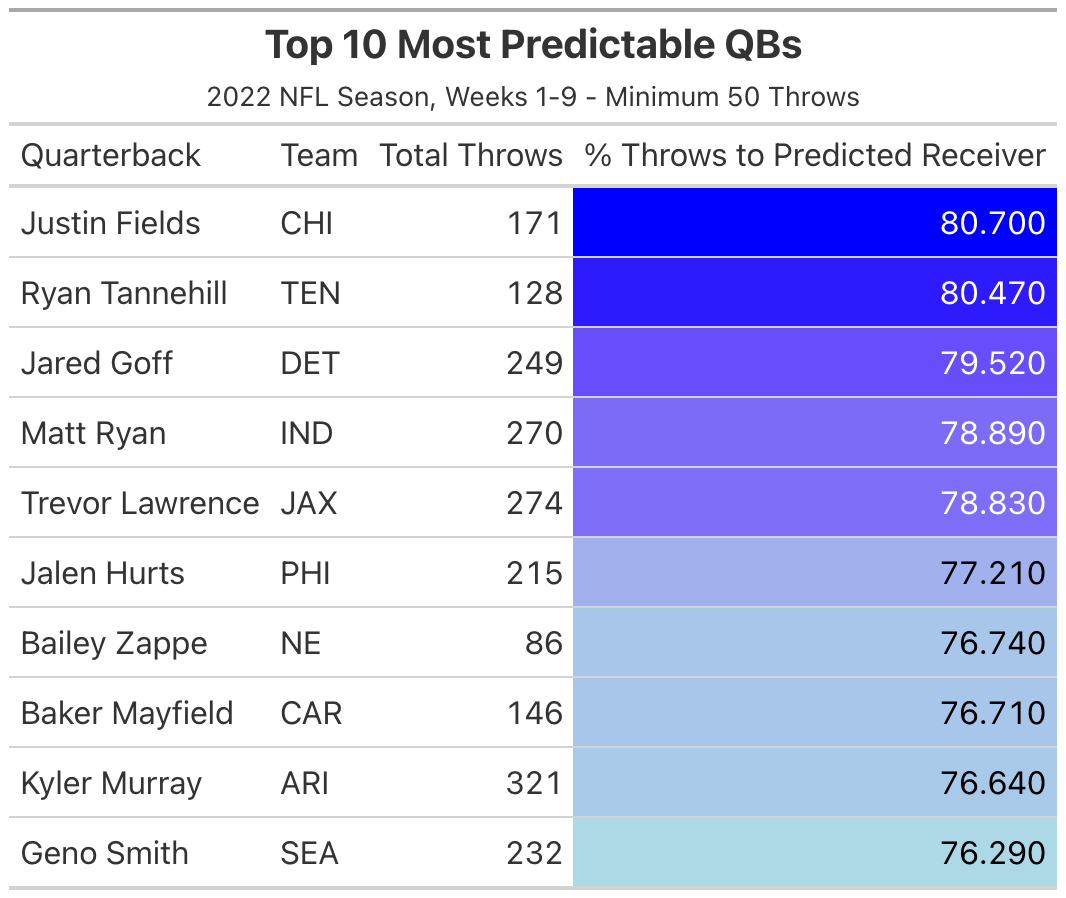
Looking at the most predictable players, we see players like Ryan Tannehill and Matt Ryan, who are moreso known at this stage of their careers for making safe, conservative throws. However, we should note that our predictability metric is a simple estimate at the moment, and not all-encompassing for a quarterback’s throwing style or skill.
Identifying Potential Opportunities for Optimization
By comparing YPA and completion rate for throws following the expected target and throws to other receivers, we can identify players who may benefit from throwing more conventional throws.
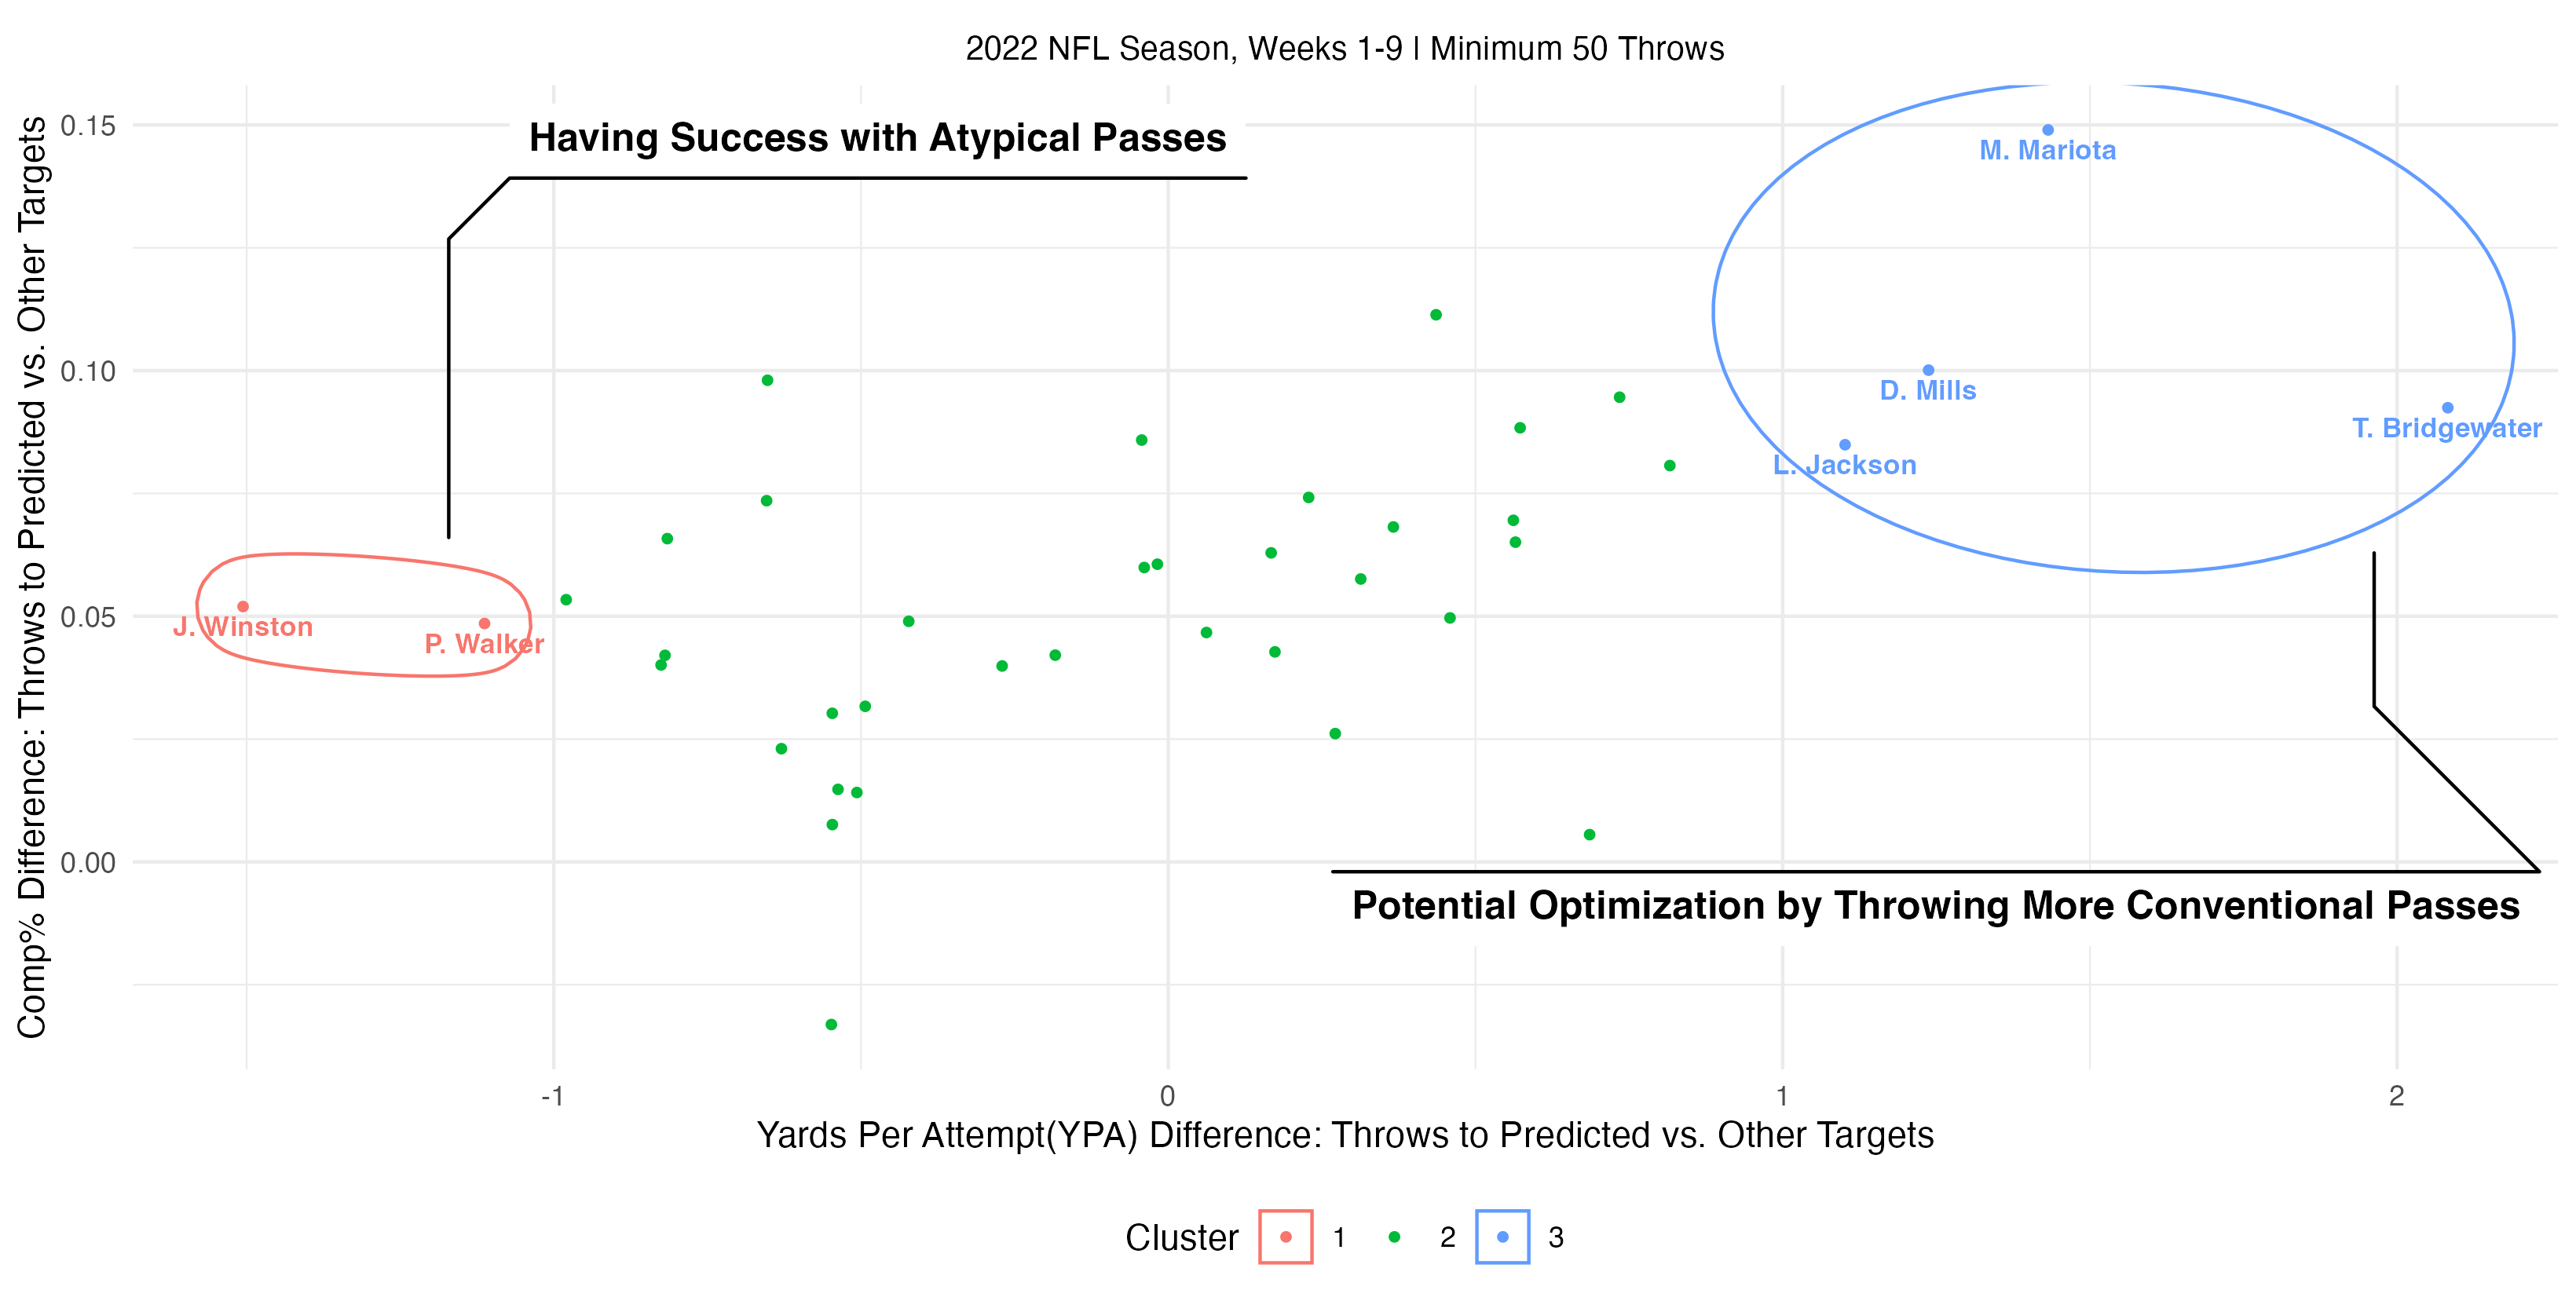
In this comparison, we see players like Teddy Bridgewater and Marcus Mariota, who gain significantly more yardage and are more accurate when throwing to the expected receiver, indicating that they benefit from generally well-trusted and known passing options.
On the other hand, players like Jameis Winston and P.J. Walker seem to find more yardage with unconventional throws, indicating that they find success with atypical, even creative passes. However, while looking at YPA, it’s important to realize that interceptions and incompletions are treated the same, so this approach may overvalue players who make risky throws that are more likely to get intercepted.
In addition, like the diverse predictabilities of our quarterbacks, players will inherently play in different situations, some without as many opportunities to have strong receivers or good pass protection, both paramount in a quarterback’s decision making process and time to make those decisions.
Model Feature Importance
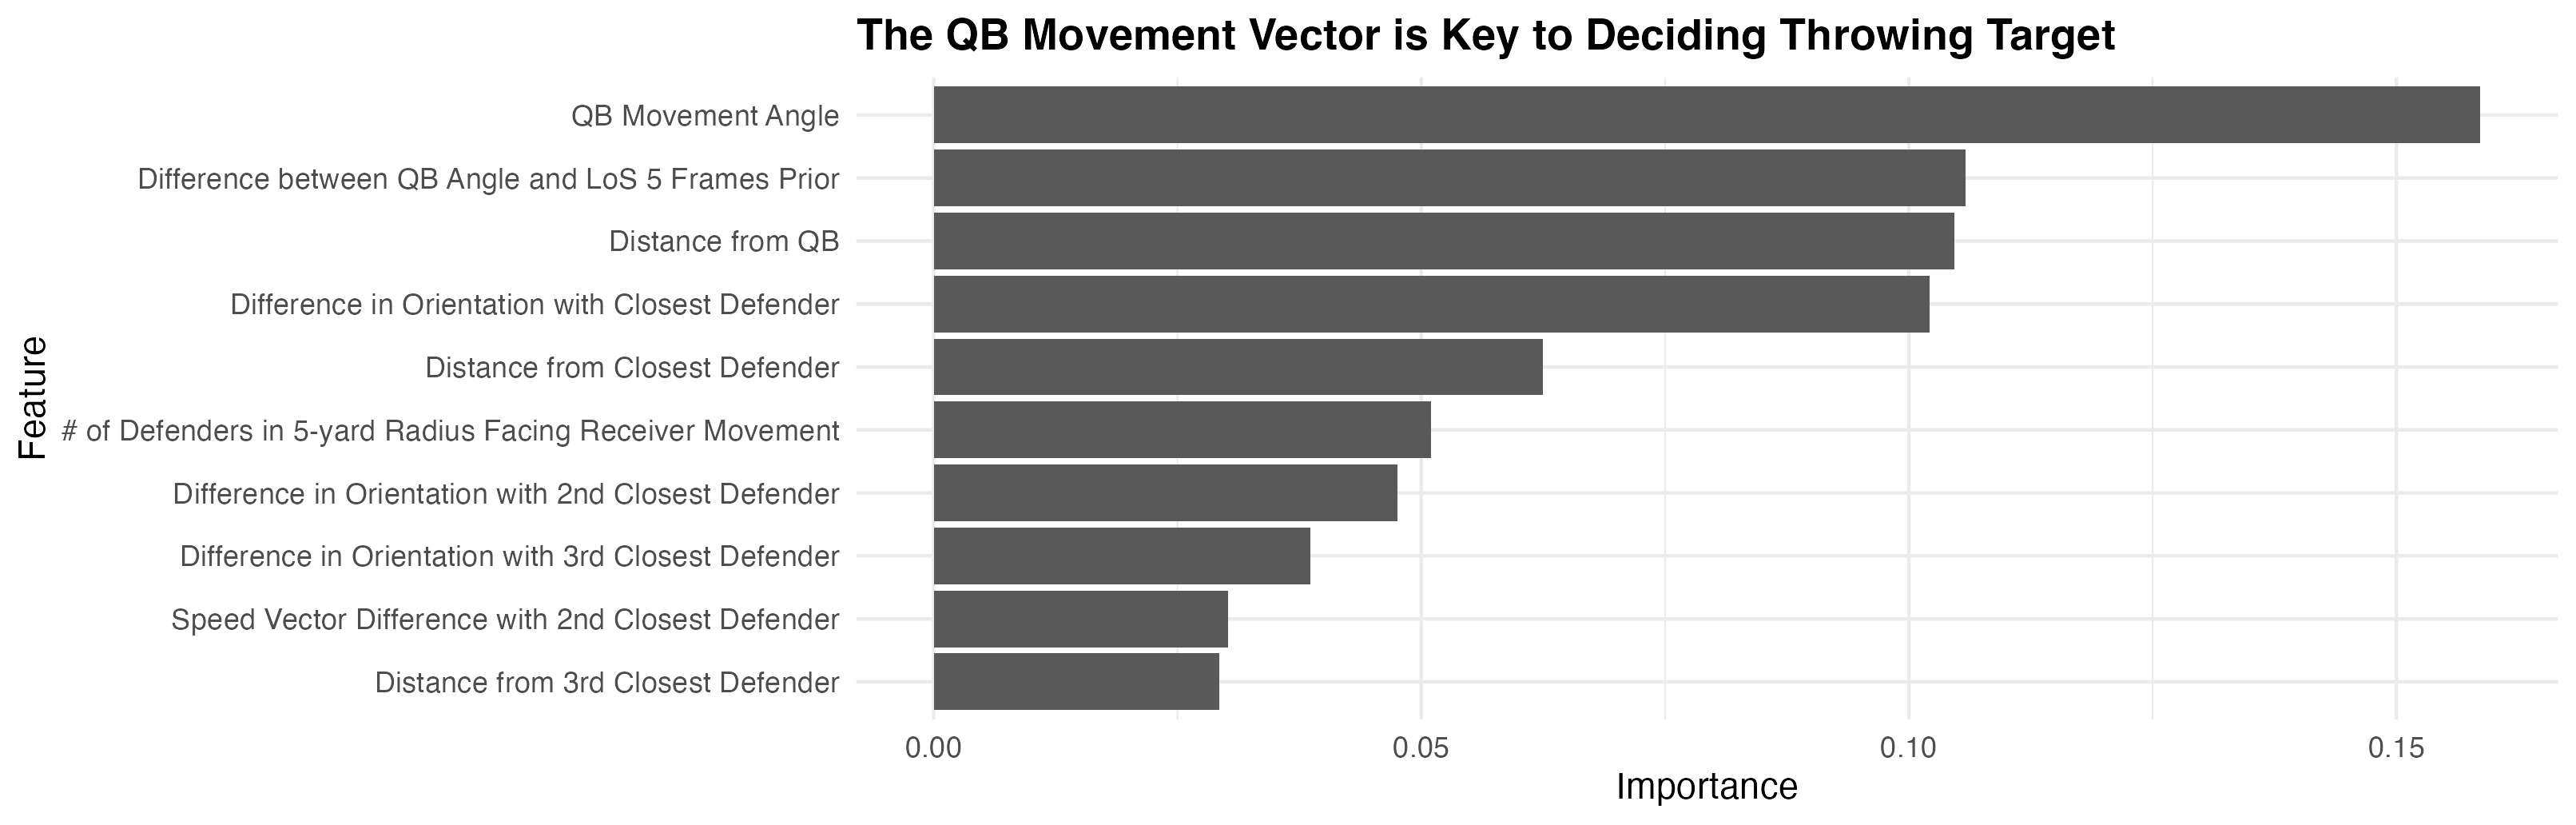
In looking at feature importance, we see that the movement direction of the quarterback and his line of sight 5 frames prior to the pass (before the throwing motion) are the most important factors in deciding the expected receiver. Given that cross-body throws are generally discouraged, the significance of the movement direction is expected. In looking at the quarterback’s line of sight, this importance is also to be expected, as it reflects the information the quarterback has by what he sees. If the quarterback is not actively aware of a certain receiver, he will almost never target him.
Discussion
Given the importance of throw decision for a quarterback, we contextualize the decisions behind these throws by building a ranking model using XGBoost on hand-crafted features like speed, velocity vector differences, and derivations of line of sight, generating a model with an accuracy of 59.9%, significantly stronger than both the naive baseline (20%) as well as throws to the most open receiver at time of throw (31.6%). Through this model, we are able to derive a number of metrics to grade the decision-making ability of a quarterback, such as point estimates for a quarterback’s predictability, as well as find opportunities for potential improvement in decision-making.
Limitations and Future Work
There are still many considerations to add more features and refine our model. For example, it may be worth looking into receiver skill as a decision, as quarterbacks are more likely to throw to their number one receiver (take DJ Moore in our example). We also only use a binary estimate for pressure, while future work should expand and add nuance to what the pressure actually looks like. Furthermore, future work should consider pre-snap factors like coverage mismatches and men in motion to update target probabilities at the start of and throughout the play. Additionally, the usage of proxies for both future separation and quarterback line of sight as well as the relatively low sample size can add bias into the model, affecting results.
In our applications of the model for QB predictability and pass decision optimization, the differences in playmaking situations that quarterbacks face inherently add bias to these point estimates, so future work should account for the quality of other decisions surrounding the passing plays.
We believe that this model can be used with other factors to generate stronger estimates of quarterback decision-making as well as performing ability. For example, if a quarterback was constantly making the optimal play in terms of expected yardage but these targets were rarely the expected ones, like we’ve seen in soccer4 research, we can generate factors for this quarterback’s creativity and ability to find impactful, hard to find throws.
Acknowledgements
We would like to thank Quang Nguyen, Dr. Ron Yurko, and our outside sponsor, Dr. Karim Kassam and Teamworks for their guidance and input on this work. In addition, we’re very grateful to the Carnegie Mellon Statistics Department for providing the opportunity and resources we needed to conduct research throughout the summer.
Footnotes
Michael Lopez, Thompson Bliss, Ally Blake, Andrew Patton, Jonathan McWilliams, Addison Howard, and Will Cukierski. NFL Big Data Bowl 2024. https://kaggle.com/competitions/nfl-big-data-bowl-2024, 2023. Kaggle.↩︎
Li, Heng & Zhang, Zhiying. (2019). Predicting the Receivers of Football Passes. 10.1007/978-3-030-17274-9_15.↩︎
Burke, Brian. “DeepQB: Deep Learning with Player Tracking to Quantify Quarterback Decision-Making & Performance.” MIT Sloan Sports Analytics Conference, 1 Mar. 2019.↩︎
Pieter Robberechts, Maaike Van Roy, and Jesse Davis. 2023. Un-xPass: Measuring Soccer Player’s Creativity. In Proceedings of the 29th ACM SIGKDD Conference on Knowledge Discovery and Data Mining (KDD ’23). Association for Computing Machinery, New York, NY, USA, 4768–4777. https://doi.org/10.1145/3580305.3599924↩︎